 BGS Data Catalogue
University of Loughborough
Type of resources
Topics
Keywords
Contact for the resource
Provided by
Years
Formats
Representation types
Update frequencies
-

Data from laboratory experiments conducted as part of project NE/K011464/1 (associated with NE/K011626/1) Multiscale Impacts of Cyanobacterial Crusts on Landscape stability. Soils were collected from eastern Australia and transferred to a laboratory at Griffith University, Queensland for conduct of experiments. Soils were characterised before, during and after simulated rainfall to determine impact of rainfall on soil surface roughness and physical crusting. For two soils (#13 DL Clay_cyano; #14 DL sand_cyano) cyanobacterial crusts were grown on subsamples and these were used to compare the response of soils with, and without, cyanobacterial soil crusts to rainfall treatment. Rainfall intensity of 60 mm hr-1 was used and rainfall was applied for 2 minutes (achieving 2 mm application), 5 minutes (achieving 5 mm application), 2 minutes (achieving 2 mm application) at 24-hour intervals with soils dried at 35°C and 30% humidity between applications in a temperature/humidity-controlled room. Variables measured were soil texture, penetrometry, salinity, splash loss, infiltration, organic matter content, occurrence of ponding, three-dimensional topography. Details of rainfall simulator, growth of cyanobacteria (where soil #13 = Acbc, soil #14 = Bcbc) and all other methods can be found in Bullard et al. 2018, 2019. Bullard, J.E., Ockelford, A., Strong, C.L., Aubault, H. 2018. Impact of multi-day rainfall events onsurface roughness and physical crusting of very fine soils. Geoderma, 313, 181-192. doi: 10.1016/j.geoderma.2017.10.038. Bullard, J.E., Ockelford, A., Strong, C.L., Aubault, H. 2019. Effects of cyanobacterial soil crusts on surface roughness and splash erosion. Journal of Geophysical Research – Biogeosciences. doi: 10.1029/2018 tbc
-
Data from laboratory experiments conducted as part of project NE/K011464/1 (associated with NE/K011626/1) Multiscale Impacts of Cyanobacterial Crusts on Landscape stability. Soils were collected from two sites in eastern Australia and transferred to a laboratory at Griffith University, Queensland for conduct of experiments. Soils were A, a sandy loam, and B a loamy fine sand. Trays 120 mm x 1200 mm x 50 mm were filled with untreated soil that contained a natural population of biota. Soils were either used immediately for experiments (physical soil crust only: PC) or were placed in a greenhouse and spray irrigated until a cyanobacterial crust has grown from the natural biota. Growth was for a period of 5 days (SS), c.30 days (MS2) or c.60 days (MS1). Following the growing period (if applicable) trays were placed in a temperature/humidity controlled room at 35° and 30% humidity until soil moisture (measured 5 mm below the surface) was 5%. Trays were then subject to rainfall simulation. Rainfall intensity of 60 mm hr-1 was used and rainfall was applied for 2 minutes (achieving 2 mm application), 8 minutes (achieving 8 mm application) or 15 minutes (achieving 15 mm application). Following rainfall, trays were returned to the temperature/humidity-controlled room under UV lighting until soil moisture at 5 mm below the surface was 5%. A wind tunnel was then placed on top of each tray in turn and a sequential series of wind velocities (5, 7, 8.5, 10, 12 m s-1) applied each for one minute duration. On each tray the five wind velocities were run without saltation providing a cumulative dust flux. For the highest wind speed, an additional simulation run was conducted with the injection of saltation sands. Three replicates of each rainfall treatment were made. Variables measured include photographs, spectral reflectance, surface roughness, fluorescence, penetrometry, chlorophyll content, extracellular polysaccharide content, Carbon, Nitrogen and splash erosion and particle-size analysis (of wind eroded material). Details of rainfall simulator, growth of cyanobacteria, laser soil surface roughness characterisation and wind tunnel design and deployment in Strong et al., 2016; Bullard et al. 2018, 2019. Bullard, J.E., Ockelford, A., Strong, C.L., Aubault, H. 2018a. Impact of multi-day rainfall events on surface roughness and physical crusting of very fine soils. Geoderma, 313, 181-192. doi: 10.1016/j.geoderma.2017.10.038. Bullard, J.E., Ockelford, A., Strong, C.L., Aubault, H. 2018b. Effects of cyanobacterial soil crusts on surface roughness and splash erosion. Journal of Geophysical Research – Biogeosciences. doi: 10.1029/2018. Strong, C.S., Leys, J.F., Raupach, M.R., Bullard, J.E., Aubault, H.A., Butler, H.J., McTainsh, G.H. 2016. Development and testing of a micro wind tunnel for on-site wind erosion simulations. Environmental Fluid Mechanics, 16, 1065-1083.
-

Data from laboratory experiments conducted as part of project NE/K011464/1 (associated with NE/K011626/1) Multiscale Impacts of Cyanobacterial Crusts on Landscape stability. Soils were collected from two sites in eastern Australia and transferred to a laboratory at Griffith University, Queensland for conduct of experiments. Soils were A, a sandy loam, and B a loamy fine sand. Trays 120 mm x 1200 mm x 50 mm were filled with untreated soil that contained a natural population of biota. Soils were either used immediately for experiments (physical soil crust only: PC) or were placed in a greenhouse and spray irrigated until a cyanobacterial crust has grown from the natural biota. Growth was for a period of 5 days (SS), c.30 days (MS2) or c.60 days (MS1). Following the growing period (if applicable) trays were placed in a temperature/humidity controlled room at 35º and 30% humidity until soil moisture (measured 5 mm below the surface) was 5%. Trays were then subject to rainfall simulation. Rainfall intensity of 60 mm hr-1 was used and rainfall was applied for 2 minutes (achieving 2 mm application), 8 minutes (achieving 8 mm application) or 15 minutes (achieving 15 mm application). Following rainfall, trays were returned to the temperature/humidity-controlled room under UV lighting until soil moisture at 5 mm below the surface was 5%. A wind tunnel was then placed on top of each tray in turn and a sequential series of wind velocities (5, 7, 8.5, 10, 12 m s-1) applied each for one minute duration. On each tray the five wind velocities were run without saltation providing a cumulative dust flux. For the highest wind speed, an additional simulation run was conducted with the injection of saltation sands. Three replicates of each rainfall treatment were made. Variables measured include photographs, spectral reflectance, surface roughness, fluorescence, penetrometry, chlorophyll content, extracellular polysaccharide content, Carbon, Nitrogen and splash erosion and particle-size analysis (of wind eroded material). Details of rainfall simulator, growth of cyanobacteria, laser soil surface roughness characterisation and wind tunnel design and deployment in Strong et al., 2016; Bullard et al. 2018, 2019. Bullard, J.E., Ockelford, A., Strong, C.L., Aubault, H. 2018a. Impact of multi-day rainfall events on surface roughness and physical crusting of very fine soils. Geoderma, 313, 181-192. doi: 10.1016/j.geoderma.2017.10.038. Bullard, J.E., Ockelford, A., Strong, C.L., Aubault, H. 2018b. Effects of cyanobacterial soil crusts on surface roughness and splash erosion. Journal of Geophysical Research – Biogeosciences. doi: 10.1029/2018. Strong, C.S., Leys, J.F., Raupach, M.R., Bullard, J.E., Aubault, H.A., Butler, H.J., McTainsh, G.H. 2016. Development and testing of a micro wind tunnel for on-site wind erosion simulations. Environmental Fluid Mechanics, 16, 1065-1083.
-
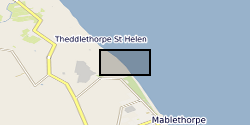
The dataset contains on-average monthly terrestrial LiDAR surveys conducted on the Lincolnshire coastline following the 2013 storm surge, collected between December 2013 and April 2015. The approximate coordinate locations of the surveys are given as follows: -EmbryoDunes (ED) 53°22'03"N 0°14'54"E -MablethorpeNorthEnd (MNE) 53°21'43"N 0°15'03"E The data were collected to record the rate and nature of recovery of the geomorphology of the back-beach and foredune zones following a storm surge in December 2013. Users interested in nearshore coastal geomorphology dynamics will find the data useful.
-

Data from laboratory experiments conducted as part of project NE/K011464/1 (associated with NE/K011626/1) Multiscale Impacts of Cyanobacterial Crusts on Landscape stability. Soils were collected from two sites in eastern Australia and transferred to a laboratory at Griffith University, Queensland for conduct of experiments. Soils were A, a sandy loam, and B a loamy fine sand. Trays 120 mm x 1200 mm x 50 mm were filled with untreated soil that contained a natural population of biota. Soils were either used immediately for experiments (physical soil crust only: PC) or were placed in a greenhouse and spray irrigated until a cyanobacterial crust has grown from the natural biota. Growth was for a period of 5 days (SS), c.30 days (MS2) or c.60 days (MS1). Following the growing period (if applicable) trays were placed in a temperature/humidity controlled room at 35° and 30% humidity until soil moisture (measured 5 mm below the surface) was 5%. Trays were then subject to rainfall simulation. Rainfall intensity of 60 mm hr-1 was used and rainfall was applied for 2 minutes (achieving 2 mm application), 8 minutes (achieving 8 mm application) or 15 minutes (achieving 15 mm application). Following rainfall, trays were returned to the temperature/humidity-controlled room under UV lighting until soil moisture at 5 mm below the surface was 5%. A wind tunnel was then placed on top of each tray in turn and a sequential series of wind velocities (5, 7, 8.5, 10, 12 m s-1) applied each for one minute duration. On each tray the five wind velocities were run without saltation providing a cumulative dust flux. For the highest wind speed, an additional simulation run was conducted with the injection of saltation sands. Three replicates of each rainfall treatment were made. Variables measured include photographs, spectral reflectance, surface roughness, fluorescence, penetrometry, chlorophyll content, extracellular polysaccharide content, Carbon, Nitrogen and splash erosion and particle-size analysis (of wind eroded material). Details of rainfall simulator, growth of cyanobacteria, laser soil surface roughness characterisation and wind tunnel design and deployment in Strong et al., 2016; Bullard et al. 2018, 2019. Bullard, J.E., Ockelford, A., Strong, C.L., Aubault, H. 2018a. Impact of multi-day rainfall events on surface roughness and physical crusting of very fine soils. Geoderma, 313, 181-192. doi: 10.1016/j.geoderma.2017.10.038. Bullard, J.E., Ockelford, A., Strong, C.L., Aubault, H. 2018b. Effects of cyanobacterial soil crusts on surface roughness and splash erosion. Journal of Geophysical Research – Biogeosciences. Doi: 10.1029/2018. Strong, C.S., Leys, J.F., Raupach, M.R., Bullard, J.E., Aubault, H.A., Butler, H.J., McTainsh, G.H. 2016. Development and testing of a micro wind tunnel for on-site wind erosion simulations. Environmental Fluid Mechanics, 16, 1065-1083.
-

Data from laboratory experiments conducted as part of project NE/K011464/1 (associated with NE/K011626/1) Multiscale Impacts of Cyanobacterial Crusts on Landscape stability. Soils were collected from two sites in eastern Australia and transferred to a laboratory at Griffith University, Queensland for conduct of experiments. Soils were A, a sandy loam, and B a loamy fine sand. Trays 120 mm x 1200 mm x 50 mm were filled with untreated soil that contained a natural population of biota. Soils were either used immediately for experiments (physical soil crust only: PC) or were placed in a greenhouse and spray irrigated until a cyanobacterial crust has grown from the natural biota. Growth was for a period of 5 days (SS), c.30 days (MS2) or c.60 days (MS1). Following the growing period (if applicable) trays were placed in a temperature/humidity controlled room at 35° and 30% humidity until soil moisture (measured 5 mm below the surface) was 5%. Trays were then subject to rainfall simulation. Rainfall intensity of 60 mm hr-1 was used and rainfall was applied for 2 minutes (achieving 2 mm application), 8 minutes (achieving 8 mm application) or 15 minutes (achieving 15 mm application). Following rainfall, trays were returned to the temperature/humidity-controlled room under UV lighting until soil moisture at 5 mm below the surface was 5%. A wind tunnel was then placed on top of each tray in turn and a sequential series of wind velocities (5, 7, 8.5, 10, 12 m s-1) applied each for one minute duration. On each tray the five wind velocities were run without saltation providing a cumulative dust flux. For the highest wind speed, an additional simulation run was conducted with the injection of saltation sands. Three replicates of each rainfall treatment were made. Variables measured include photographs, spectral reflectance, surface roughness, fluorescence, penetrometry, chlorophyll content, extracellular polysaccharide content, Carbon, Nitrogen and splash erosion and particle-size analysis (of wind eroded material). Details of rainfall simulator, growth of cyanobacteria, laser soil surface roughness characterisation and wind tunnel design and deployment in Strong et al., 2016; Bullard et al. 2018, 2019. Bullard, J.E., Ockelford, A., Strong, C.L., Aubault, H. 2018a. Impact of multi-day rainfall events on surface roughness and physical crusting of very fine soils. Geoderma, 313, 181-192. doi: 10.1016/j.geoderma.2017.10.038. Bullard, J.E., Ockelford, A., Strong, C.L., Aubault, H. 2018b. Effects of cyanobacterial soil crusts on surface roughness and splash erosion. Journal of Geophysical Research – Biogeosciences. doi: 10.1029/2018. Strong, C.S., Leys, J.F., Raupach, M.R., Bullard, J.E., Aubault, H.A., Butler, H.J., McTainsh, G.H. 2016. Development and testing of a micro wind tunnel for on-site wind erosion simulations. Environmental Fluid Mechanics, 16, 1065-1083.
-
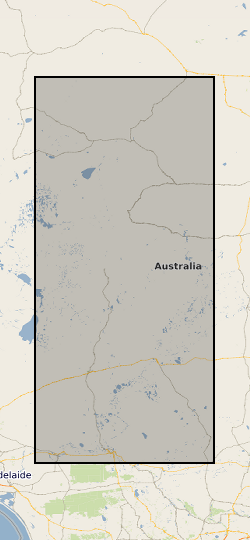
This dataset presents field measurements of the biological response of cyanobacterial soil crusts to rainfall and of the impact of this response on the susceptibility of the soil surface to wind erosion. The data are in Excel spreadsheets and record cyanobacteria fluorescence, the presence of chlorophyll a and exocellular polysaccharide, soil surface strength, particle size distribution and soil loss by wind erosion. The study was located within Diamantina National Park (23°36’44.8”S; 143°17’46.9”E) in the north-eastern part of the Lake Eyre basin, central Australia. Site characteristics are 1/A physical depositional crust; 2/B cyanobacterial crust on dune flank; 3/D cyanobacterial crust on claypan; 4/E physical structural crust; 5/C cyanobacterial crust on nebkha field. Different amounts of rainfall were applied using Griffith University Mobile Rainfall Simulator (see Bullard et al. 2018 for technical details). Following rainfall and drying in situ of the surface, wind erosion was measured using a portable mini-wind tunnel (see Strong et al. 2016 for technical details). The data will be of value for understanding cyanobacterial response to different rainfall amounts and wind speeds under future climate scenarios. The project principal investigator was Prof. Joanna Bullard and data Quality Assurance by Dr. Helene Aubault. Bullard, J.E., Ockelford, A., Strong, C.L., Aubault, H. 2018. Impact of multi-day rainfall events onsurface roughness and physical crusting of very fine soils. Geoderma, 313, 181-192. doi: 10.1016/j.geoderma.2017.10.038. Strong, C.L., Leys, J.F., Raupach, M.R., Bullard, J.E., Aubault, H.A., Butler, H.J., McTainsh, G.H. 2016. Development and testing of a micro-wind tunnel for on-site wind erosion simulations. Environmental Fluid Mechanics 16, 1065-1083.
-
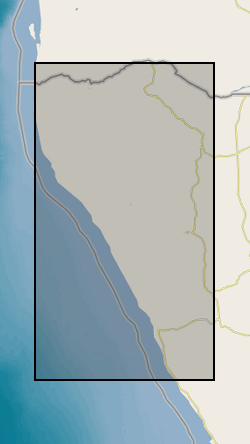
Wind, sediment transport and surface/saltation data collected at Huab River Valley during a field campaign in September 2019 to investigate saltation on gravel and sand surfaces. Surface/saltation data: This is terrestrial laser scanned (TLS) data collected over sand and gravel surfaces during multiple days when saltation was active, on a surface approximately 8 m from the TLS, perpendicular to the wind direction. The data is raw point cloud format in text columns of x, y and z coordinate data. Files are named *_^_scan& where * is the date that the data was collected in yymmdd format, ^ is surface type (sand or gravel) and & is the scan number. Each data set uses the same coordinate system. Data can be viewed in any spatial software. Wind and sediment data were collected from a fixed point on each surface, directly downwind of the TLS data. The data is in csv file format with column titles and can be viewed in any text or database software. Data include hot wire measurements at different heights, Wenglor counts, sensit counts and 3D sonic measurements on some days. Sonic data is at 10 Hz, hotwire data at 10 second intervals, transport data is given within both datasets.